
Overview
Nutrition math is simple but easy to misapply: databases publish nutrients per 100 g, and your recipe is just a scaled sum of those values. Most “wrong results” come from mismatched assumptions (raw vs cooked, drained vs undrained, edible vs inedible weight).
This page supports single foods (one item) and multi-ingredient recipes (several items). The totals reflect the full dish, and “per serving” is a pure division step: it is only as accurate as your portioning.
Useful companions: Recipe Cost Calculator for budgeting, Unit Converters for measurement cross-checks, Cooking & Baking tools for kitchen planning, Health & Fitness tools for broader targets, and Trackers & Timers for meal-prep routines.
What the outputs mean (interpretation, not UI)
- Total energy: recipe energy summed across items (shown in kcal and kJ). It represents the entire entered dish.
- Protein / Carbohydrates / Fat: grams summed across items. These are the “big three” macros used for most quick comparisons.
- Per-item breakdown: lets you verify the grams used in the math and spot the ingredient that dominates calories.
- Detailed nutrition + Daily %: shows micronutrients (when available) and calculates Daily % from per-serving amounts.
High-impact inputs (the three biggest error sources)
- Ingredient match: “chicken breast, raw” vs “chicken breast, roasted” can differ because water content changes weight and concentration.
- Unit semantics: grams scale directly; volumes (ml/tsp/tbsp/cup) require a density assumption and can drift for oils, powders, and thick liquids.
- Serving logic: Daily % is computed per serving; if you split a pot into 3 large bowls but enter 6 servings, Daily % will look falsely low.
Formula/Methodology
Each ingredient contributes nutrients proportional to its mass. The calculator scales per-100 g values to your “used grams,” sums totals, then divides by servings for per-serving results.
For each ingredient i:
  grams_i   = mass used in calculations
  scale_i   = grams_i / 100

  kcal_total    += kcal_100g_i    * scale_i
  protein_total += protein_100g_i * scale_i
  carbs_total   += carbs_100g_i   * scale_i
  fat_total     += fat_100g_i     * scale_i

Per serving:
  value_per_serving = value_total / servings

Daily % (per nutrient):
  daily_percent = (per_serving_amount / reference_value) * 100
Energy conversions and “macro calorie” cross-check
kJ is a unit conversion (not a different calorie). A quick sanity-check is to compare total kcal against “macro calories” from the 4/4/9 convention. A mismatch is not automatically an error, but it is a signal to inspect assumptions.
| Check | Rule of thumb | When it fails (not a bug) |
|---|---|---|
| kJ vs kcal | kJ ≈ kcal x 4.184 | Rounding can cause small differences. |
| Macro calories | (Protein x 4) + (Carbs x 4) + (Fat x 9) | Alcohol (7 kcal/g), fiber conventions, organic acids, and database/label rounding. |
| Salt vs sodium | Salt (g) ≈ sodium (g) x 2.5 | Labels may report salt while databases report sodium; the factor is an approximation. |
Unit conversions and density assumptions (where big errors happen)
Per-100 g nutrition scales by mass, but kitchen measures can be volume. Converting volume to grams requires density; if density is unknown, any default assumption can be wrong.
| Entered unit | What it really measures | Math needs | Common logic mistake |
|---|---|---|---|
| g / oz (wt) / lb | Mass | Direct grams for scaling | Mixing cooked weights with raw database entries (or the reverse). |
| ml | Volume | Density to convert to grams | Treating ml as grams for oils or thick sauces; 1 g/ml is a water-like approximation, not universal. |
| tsp / tbsp / cup | Volume | Volume-to-ml + density-to-grams | Heaped vs level spoons; packed vs loose cups (especially powders) change mass materially. |
Common math/logic mistakes (and the exact failure mode)
- Raw vs cooked mismatch: cooked meat loses water, so “100 g cooked” typically contains more protein than “100 g raw.”
- Dry vs cooked grains: cooked rice/pasta weighs much more due to absorbed water, so grams must match the entry state.
- Edible portion errors: bones, shells, peels, and drained brine are not eaten; entering gross weight inflates totals.
- Oil accounting bias: calories can be dominated by fat; entering “oil poured” instead of “oil eaten” can overestimate by hundreds of kcal.
- Serving count drift: Daily % uses per-serving amounts; if portioning is off, the Daily % interpretation is off even when recipe totals are correct.
Daily % reference modes (why the same recipe can show different %DV)
Daily % is not a universal constant; it depends on the reference table you choose. The EU mode follows Regulation (EU) No 1169/2011 (Annex XIII reference intakes and NRVs), and the US mode follows 21 CFR 101.9 (FDA Daily Values).
Examples
These examples show how the calculations behave. Your exact numbers depend on the database match and the amounts you enter.
Example 1: One food (single-item scaling)
- Database entry: 250 kcal per 100 g
- Amount eaten: 60 g
- Scale = 60 / 100 = 0.60
- Calories contributed = 250 x 0.60 = 150 kcal
Example 2: Recipe totals + per-serving Daily %
- Recipe totals after summing: 1,200 kcal, 80 g protein, 90 g carbs, 45 g fat
- Servings entered: 4
- Per serving: 300 kcal, 20 g protein, 22.5 g carbs, 11.25 g fat
- Daily % uses these per-serving values, divided by the selected EU/CH/US reference.
Example 3: Why volume can distort calories (density problem)
- Case: a “tbsp of oil” vs “tbsp of water” have very different grams, but the same volume.
- If density is unknown and a water-like assumption is used, oil grams can be underestimated and calories will look too low.
- Math fix: use a weight for high-calorie items (oils, nut butters, cheese) because small gram errors create large kcal errors.
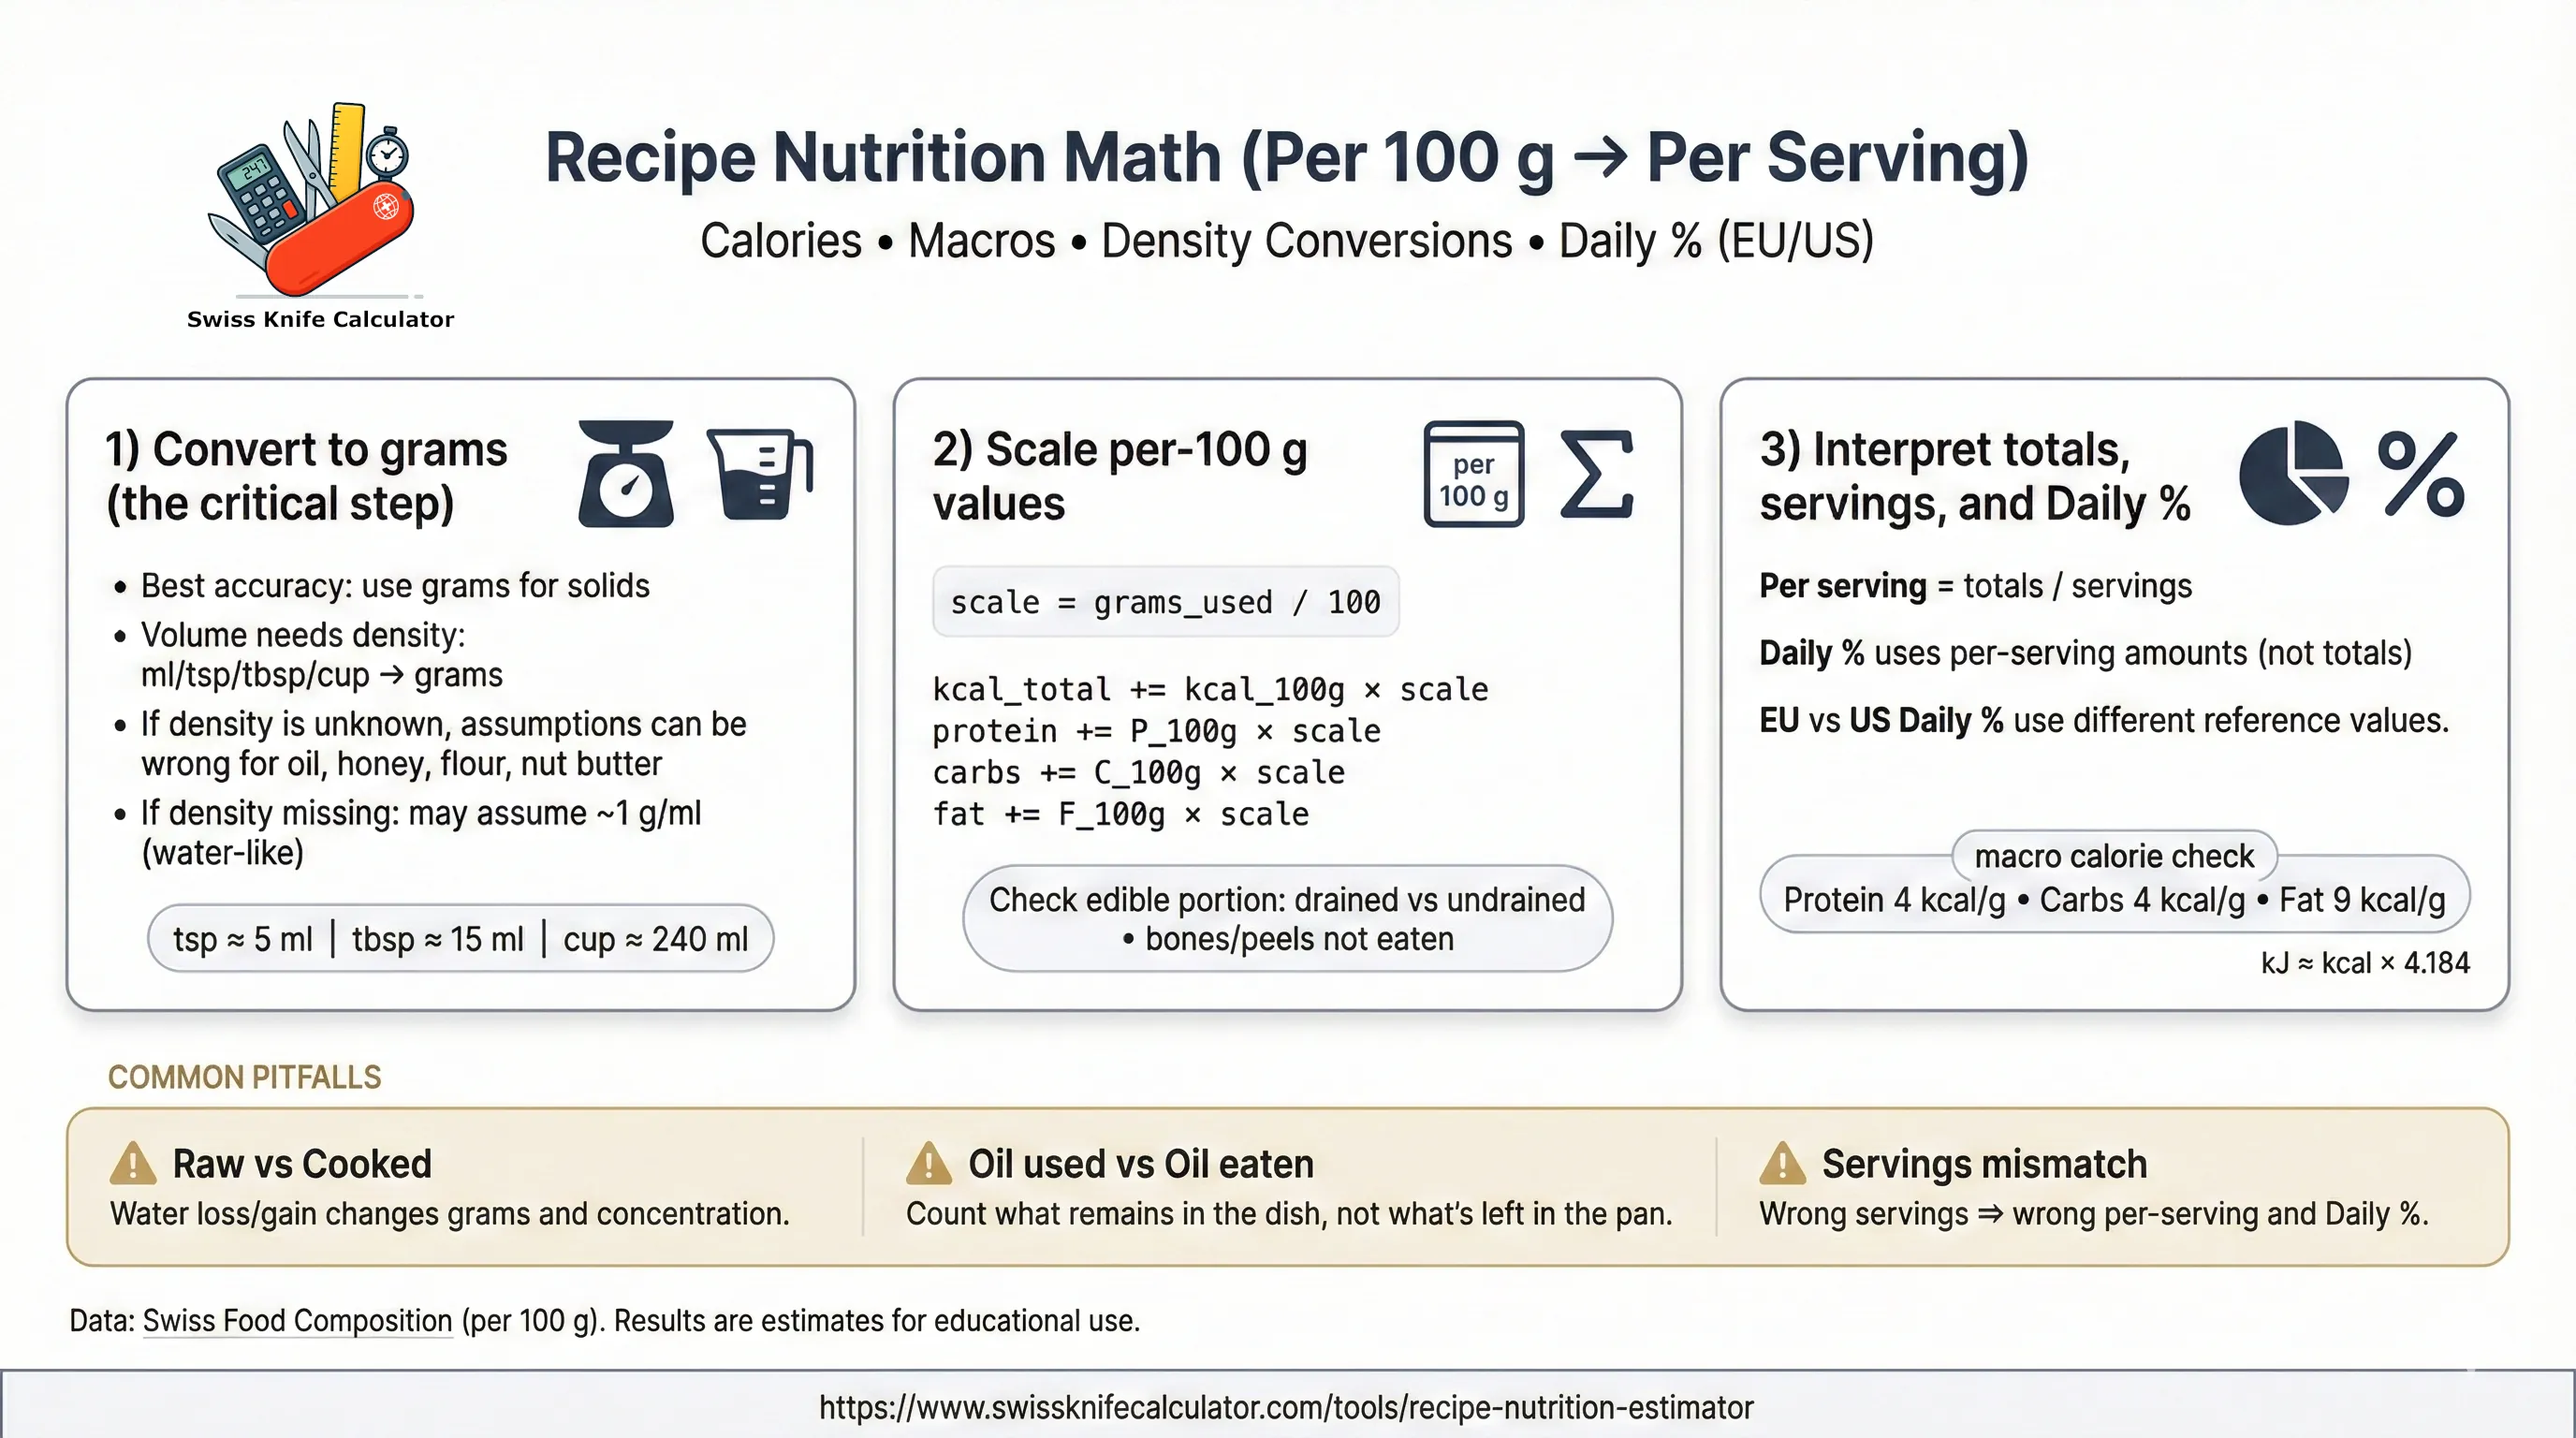
Infographic & Visual Guide
Think in three steps: (1) convert everything to grams used, (2) scale per-100 g values, (3) interpret per-serving and Daily %. When results look surprising, the per-item table is your audit trail.
Quick “does this make sense?” checks
- If fat grams are high: check oils, cheese, nuts, and dressings first; they often dominate calories.
- If carbs look too high or too low: verify dry vs cooked entries for grains and pasta; water changes weight dramatically.
- If micronutrients seem low: some items may not include that nutrient in the database, so totals can be undercounted.
Use Cases
Practical ways to use these numbers (planning & comparisons)
- Meal prep portioning: set servings to match how you actually portion containers, then use per-serving totals as your baseline.
- Recipe iteration: compare two versions of the same dish (less oil, leaner protein, higher-fiber sides) and inspect what changed in the per-item breakdown.
- Macro balance audit: use the macro chart to see whether calories are mostly coming from fat, carbs, or protein.
- “Single food” evaluation: enter one item to compare similar foods using the same measurement assumptions.
How to evaluate the “nutritional value” of a food or recipe (a concrete framework)
“Healthy” depends on goals, but your results can be evaluated with a few math-first metrics. These are comparison tools, not medical thresholds.
| Metric | How to compute from results | What it helps you notice |
|---|---|---|
| Protein density | Protein (g) per serving divided by kcal per serving (g per 100 kcal) | Whether a dish is protein-meaningful or mostly energy from fats/carbs. |
| Energy density | Total kcal divided by total grams eaten (use “Used (g)” sums), then scale per 100 g | Meals that are easy to overeat because calories are concentrated (oils, nuts, cheese). |
| Added-fat leverage | Compare version A vs B by changing only oils/butter and re-checking fat grams | Small oil changes can swing calories more than people expect. |
| Sodium vs salt sanity | If you see sodium (mg), convert roughly to salt using salt ≈ sodium x 2.5 | Why “salt” on labels may look different from “sodium” in databases. |
| Daily % distribution | Look at the Daily % column (per serving) across nutrients | Which nutrients are being meaningfully contributed vs barely present. |
Assumptions & limits (important for correct interpretation)
- Database values are generic: brand formulations can differ materially, especially for processed foods.
- Missing nutrients: if an item lacks a nutrient entry, totals for that nutrient can be underestimated.
- Cooking effects are not auto-modeled: water gain/loss and oil retention change per-gram reality; your input state must match the database state.
- Volume-to-mass uncertainty: volumes need density; default assumptions can be wrong for oils, powders, and thick liquids.
- Daily % is reference-based: EU/CH/US Daily % uses standard reference tables and may not match personal targets.
License, data sources, and attribution (Swiss DB + Daily Value standards)
Nutrition values on this page are derived from the Swiss Food Composition Database (FSVO/FDHA), expressed per 100 g of edible portion. If you publish results (blog, cookbook, app screenshots), attribute the source in plain language (example: “Swiss Food Composition Database (FSVO)”).
- Swiss Food Composition Database: naehrwertdaten.ch (downloads and terms: downloads and legal/terms).
- EU Daily % mode: reference intakes + NRVs are based on Regulation (EU) No 1169/2011, Annex XIII (EUR-Lex: CELEX:32011R1169).
- US Daily % mode: FDA Daily Values are based on 21 CFR 101.9 (eCFR: Section 101.9).
- Switzerland mode in this tool: implemented as EU-aligned references for practical comparability; treat it as informational and update to Swiss primary references if you adopt an official Swiss table.
FAQ
How accurate are the calories and macros?
Results are estimates scaled from per-100 g values. Accuracy depends on choosing the closest match, using edible amounts, and avoiding raw vs cooked weight mix-ups.
Why do my results differ from a package label?
Brands, rounding rules, and preparation state (as sold vs as prepared) vary. Cooking yield, drained liquids, and added oil can shift per-serving totals even if totals look correct.
Should I enter raw weight or cooked weight?
Use the weight that matches the nutrition entry (raw vs cooked). Water loss concentrates nutrients in cooked meat, while water absorption dilutes values for cooked rice, pasta, and legumes.
What does “per serving” mean in this calculator?
Per serving equals the recipe total divided by the serving count you enter. If your real portions are larger or smaller, multiply the per-serving numbers by the portion size you actually eat.
How are ml, teaspoons, tablespoons, and cups converted to grams?
Volume units are converted to an estimated mass using density when available. If density is missing or unreasonable, the tool may fall back to a water-like 1 g/ml assumption, which can be wrong for oils, powders, and thick liquids.
Why can macro calories (4/4/9) differ from total kcal?
Macro calories use Protein x 4, Carbs x 4, Fat x 9 as an approximation. Differences happen with alcohol (7 kcal/g), fiber conventions, organic acids, and label/database rounding.
What is included in the “Detailed nutrition” table?
The detailed table shows only nutrients present in the database for your selected items. If a nutrient is missing for one or more items, totals for that nutrient can be underestimated.
How is Daily % calculated and which standards are available?
Daily % is calculated from per-serving amounts divided by the selected reference value (EU, Switzerland EU-aligned, or US). If servings are wrong, Daily % will be wrong even if totals are correct.
What does “Switzerland (EU-aligned)” mean for Daily %?
In this tool, the Switzerland mode uses EU-aligned reference values as a practical proxy. Treat the Daily % as an educational comparison, not a legal nutrition label for Switzerland.
What if an ingredient is not found or the match looks wrong?
Choose the closest generic equivalent and make sure the amount reflects what is eaten (edible portion, drained vs undrained). A poor match can distort calories, macros, and micronutrients more than small measurement errors.
How should I handle oils, marinades, and cooking losses?
Count what ends up in the final dish, not what was poured into the pan. If oil is discarded or sauce is left behind, entering the full amount will systematically overestimate fat, calories, and some micronutrients.
Can I use this for medical diets, allergies, or clinical nutrition decisions?
No. Use official labels and qualified professionals for medical diets, allergies, and clinical needs. This estimator is for planning, learning, and rough comparisons.
Last review: January 2026
Disclaimer:
Nutrition outputs are estimates for informational use only. Results can differ from branded labels and real cooked outcomes due to ingredient variation, cooking yield, edible portion, missing nutrients, density assumptions, and rounding conventions. For medical diets, allergies, or clinical guidance, rely on official labels and qualified professionals.