
BMI-for-Age Calculator for Children & Teens (2–19 Years)
Calculate BMI percentile, classification, and z-score for boys and girls using CDC growth data.
Results
📘 Overview: BMI-for-Age Calculator for Children & Teens
The BMI-for-Age Calculator for Children and Teens estimates a child’s Body Mass Index (BMI) and compares it to standardized percentile curves to determine weight status for ages 2 to 19 years. Unlike adult BMI categories, child and teen BMI assessments account for both age and gender, using LMS (Lambda Mu Sigma) data from the CDC's Extended BMI-for-age Growth Charts.
This calculator helps parents, caregivers, pediatricians, and school health officials track growth trends, identify weight concerns early, and support healthy development.
📐 Formula & Methodology
BMI Formula:
Imperial: BMI = (703 × weight in lbs) / (height in inches)²
Metric:   BMI = weight in kg / (height in meters)²
Z-Score Calculation (LMS Method):
z = [(BMI / M)L – 1] / (L × S)
Where L, M, and S are statistical values derived from CDC reference curves. The z-score is then converted to a percentile to classify the child’s weight status.
📊 Example Calculation
Child: 12 years 6 months old male
Weight: 42 kg
Height: 148 cm
Step 1 – BMI:
BMI = 42 / (1.48²) = 19.17
Step 2 – LMS Values:
L: -2.38585803, M: 18.1387275, S: 0.13299058
Step 3 – Z-score:
z ≈ 0.39 → Percentile ≈ 65.2%
Result: Healthy weight category
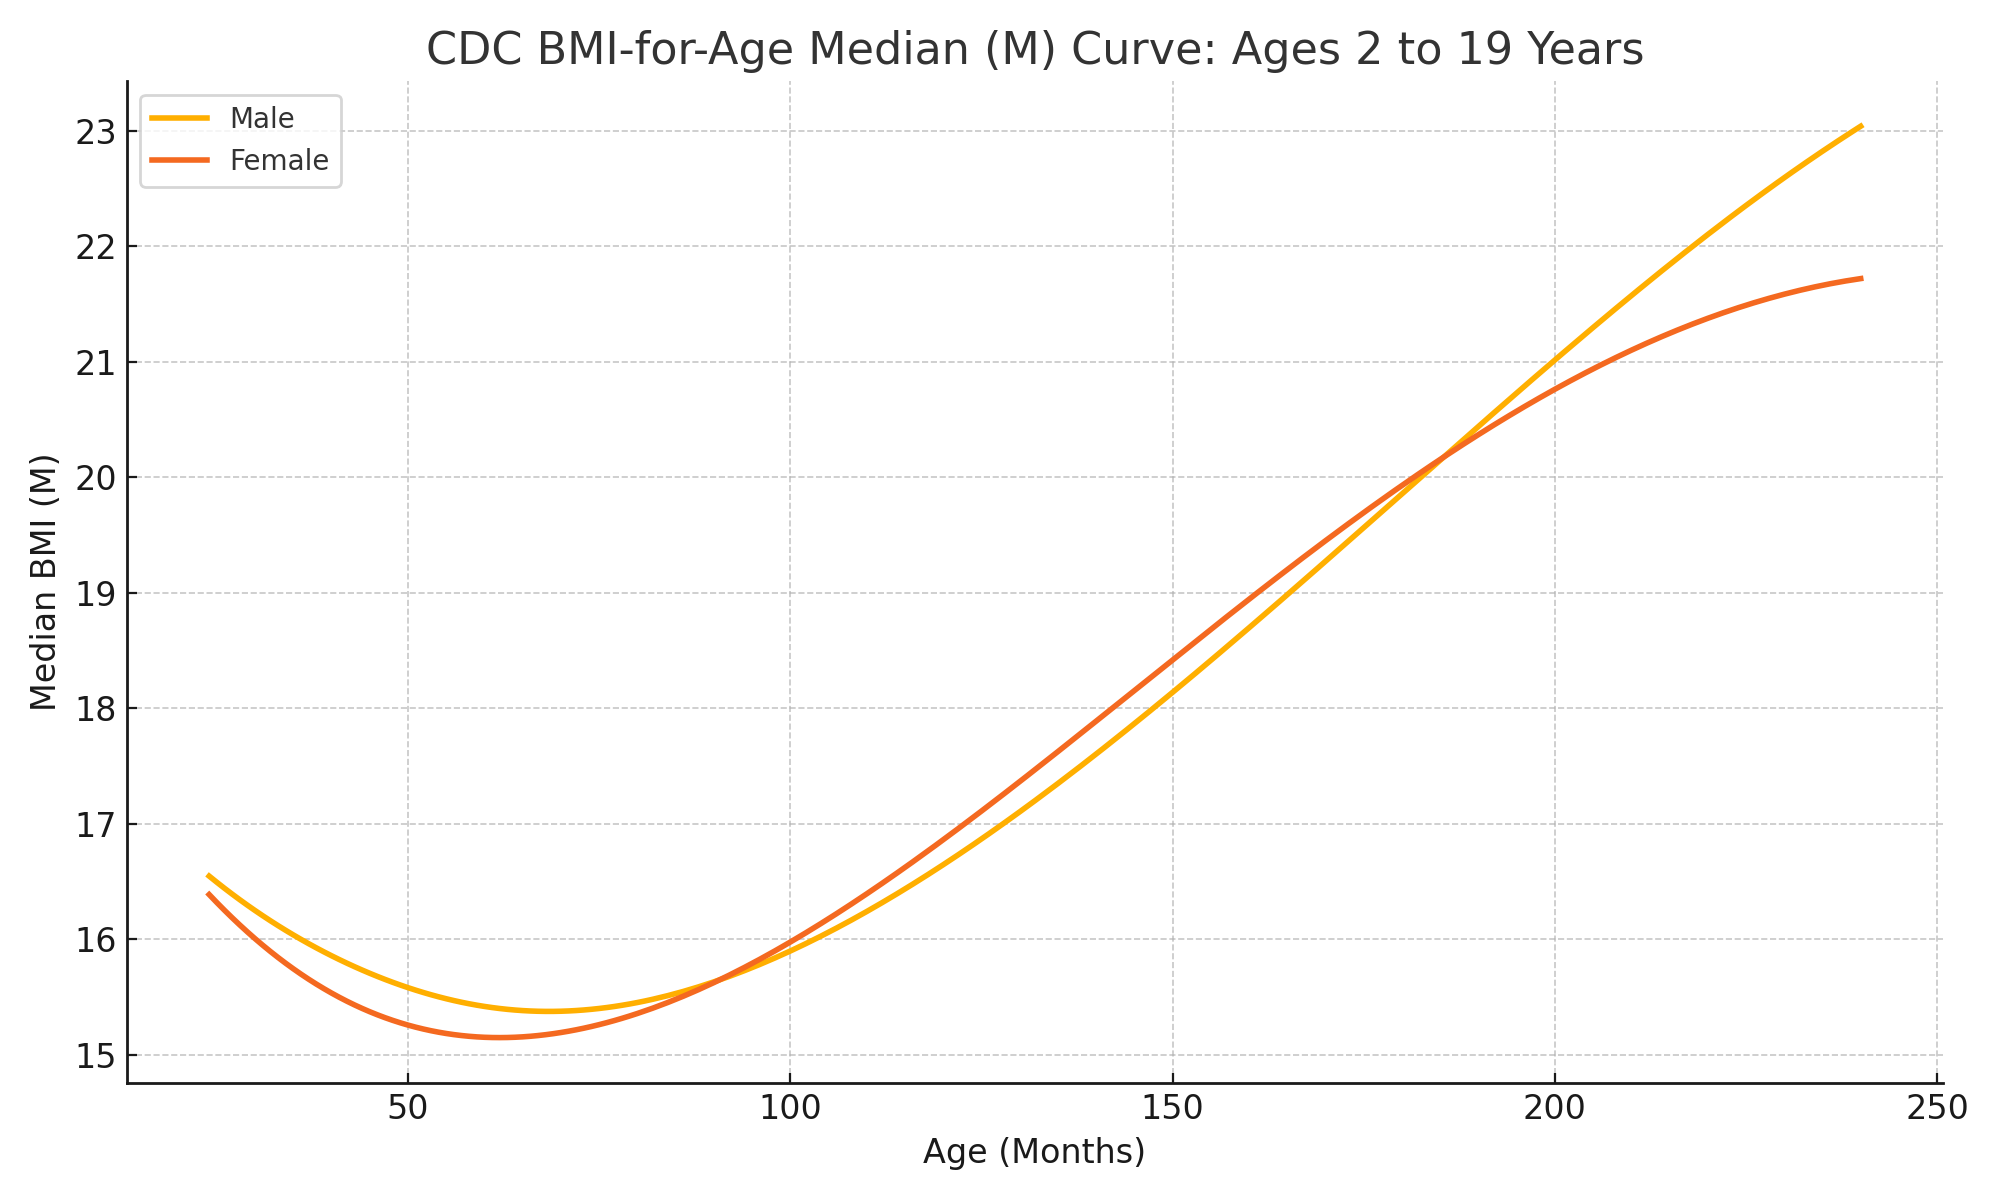
📈 CDC BMI-for-Age Growth Curve
This chart shows the median BMI trend for boys and girls from ages 2 to 19 years, based on CDC growth data.
🧠 Use Cases
- 🩺 Pediatric health evaluations
- 🏫 School or sports health screenings
- 👪 Parental monitoring of child growth
- 📈 Tracking childhood obesity trends
- 📚 Educational and research purposes
❓ Frequently Asked Questions
📌 Why is BMI calculated differently for children?
Children’s body composition changes as they grow, and the relationship between BMI, age, and gender is dynamic. Hence, BMI-for-age percentiles are used instead of fixed thresholds like in adults.
📌 What do the percentiles mean?
Percentiles compare a child's BMI with peers of the same age and sex. For example, a 75th percentile means the child has a higher BMI than 75% of peers.
📌 What is a healthy BMI percentile for children?
According to the CDC:
- Underweight: Below 5th percentile
- Healthy: 5th to 84th percentile
- Overweight: 85th to 94th percentile
- Obese: 95th percentile or above
📌 Can I use this calculator for children under 2?
No, this tool is designed for children 2–19 years old. Infants require specialized growth charts (e.g., WHO standards).
📌 What data is this based on?
The tool uses the CDC’s Extended LMS parameters dataset available at: Data file for the Extended CDC BMI-for-age Growth Charts for Children and Adolescents
📌 How accurate is this tool?
It uses medically standardized LMS data and calculations identical to those used by healthcare professionals, ensuring a high level of accuracy. However, it's not a substitute for medical advice.
📌 Is the BMI bar below the results interactive?
No, the BMI percentile indicator bar is a visual aid to quickly show where the result lies among the four main classifications.
📌 Does this tool support both imperial and metric units?
Yes. You can switch between imperial (lbs/in) and metric (kg/cm) systems using the unit selector.