
Configure Your Ball Picking Experiment
Exact Probability
No calculation yet. Configure your experiment and click “Calculate”.
- Probability (decimal): –
- Probability (%): –
- Approximate 1 in N: –
- Fraction (if simple): –
Ball Composition (Visual)
Monte Carlo Simulation (Theory vs. Experiment)
Run repeated random experiments to see how often your event occurs and compare the simulated frequency with the exact theoretical probability.
For teaching, 500–2,000 trials are usually enough. Larger values give smoother results but take a bit longer.
No simulation yet. Use the same settings above and click “Run Simulation”.
Random Draw Visualizer
Use the same composition, draw count, and replacement mode above, then generate one or more random draws to see concrete outcomes like “2 Red and 1 Blue”. Each draw here is an independent experiment.
No random draws yet. Set your composition and click “Draw Random Balls” to see detailed results for each draw.
🎲 Overview: Ball Picking Probability & Urn Experiments
This page is an urn probability calculator for classic “colored balls in a container” questions. You enter the ball counts, choose how many times you draw, and decide whether each draw is made with replacement (the ball goes back) or without replacement (the ball stays out). The tool then computes an exact theoretical probability and lets you verify it using a Monte Carlo simulation.
You can calculate events such as:
- Exactly k balls of a chosen color
- At least one ball of a chosen color (via the complement rule)
- None of a chosen color
- All drawn balls are the same color (works for any number of colors)
Quick navigation: you’ll find the exact probability first, then the simulation chart, then a random draw visualizer for concrete outcomes like “2 Red and 1 Blue”. For related tools, see the Hypergeometric Distribution Calculator, the Deck of Cards Probability Calculator, and the Random Number Generators hub.
Which mode should I use? (binomial vs. hypergeometric)
| Question wording | Correct mode | Why |
|---|---|---|
| “draw and put it back each time”, “independent draws” | With replacement (Binomial) | Same success probability p every draw |
| “without replacement”, “no replacement”, “sample without replacement” | Without replacement (Hypergeometric) | Composition changes → probabilities change each draw |
| Finite deck/urn where draws remove items | Without replacement | Depends on what you already drew |
| Very large population + small sample (approx.) | Often with replacement is a good approximation | Removal barely changes proportions (rule of thumb) |
Feasibility checks (why “impossible” happens)
- Without replacement: you must have
drawCount ≤ totalBalls. - Exactly k of a color: you must have
k ≤ min(drawCount, countOfColor). - All same color (without replacement): at least one color must satisfy
countOfColor ≥ drawCount.
Tip (logic, not UI): when you’re unsure, first ask “does the urn composition change after a draw?” If yes, you’re in hypergeometric territory.
📐 Formulas Used (and when each one applies)
Definitions
- N = total balls in the urn
- R = balls of the target color (your “success” color)
- n = number of draws
- k = number of target-color balls you want
- p = single-draw success probability (only constant in “with replacement”):
p = R / N
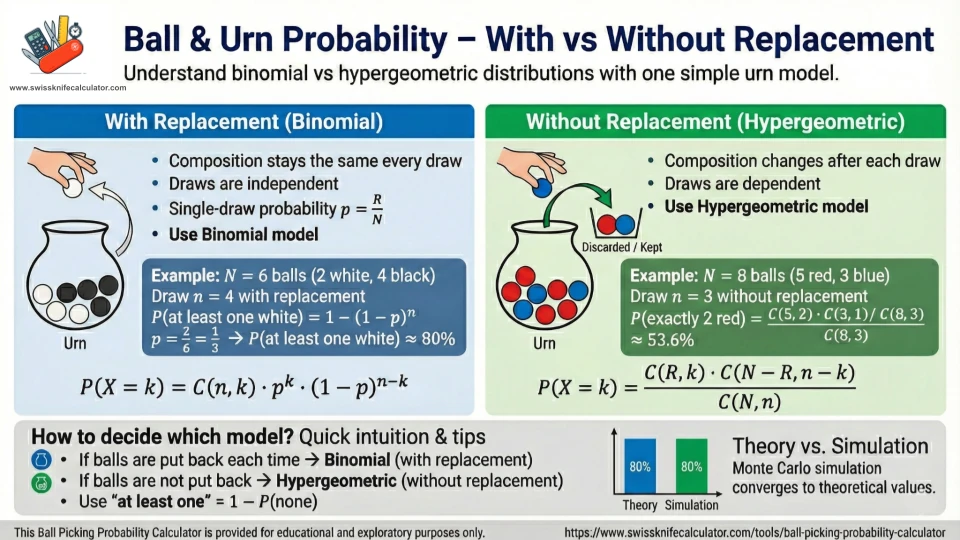
With replacement → Binomial distribution
With replacement, each draw has the same probability p of being the target color.
The number of successes X in n draws follows:
P(X = k) = C(n, k) · p^k · (1 − p)^(n − k)
“None” and “At least one” (binomial shortcut)
P(none) = (1 − p)^n
P(at least one) = 1 − (1 − p)^n
Without replacement → Hypergeometric distribution
Without replacement, the urn composition changes, so we use the hypergeometric model:
P(X = k) = [C(R, k) · C(N − R, n − k)] / C(N, n)
“At least one” via complement (hypergeometric)
A common exam trick is to compute “at least one” using “none”:
P(at least one) = 1 − P(none)
P(none) = C(N − R, n) / C(N, n)
All drawn balls are the same color (multi-color urn)
This event is a sum over colors. Let C_c be the count of color c, and p_c = C_c / N.
With replacement:
P(all same) = Σ p_c^n
Without replacement:
P(all same) = [Σ C(C_c, n)] / C(N, n)
Common mistake: forgetting that colors with C_c < n contribute 0 in the “without replacement” formula.
The tool automatically ignores those terms.
Why simulation won’t match perfectly (and why that’s normal)
- Monte Carlo estimates have sampling noise; with 1,000 trials, being off by a few percent can be normal.
- As you increase trials, the estimate usually moves closer to the exact probability (law of large numbers).
- If an event is very rare (e.g., 0.1%), you need many more trials to “see it” reliably.
Practical teaching tip: run 200 trials (noisy), then 1,000 (better), then 10,000 (stable) and show how the bar chart settles.
Performance note: very large N and n create huge combinations. If you hit limits, scale counts down while keeping proportions similar (for binomial probabilities, proportions matter most; for hypergeometric, absolute counts matter, but scaled-down classroom examples often teach the same idea).
📊 Worked Examples (matching how the tool calculates)
Example 1 — Exactly 2 red in 3 draws (without replacement)
Urn: 5 red, 3 blue → N = 8, R = 5. Draw n = 3, want k = 2.
P(X = 2) = [C(5,2) · C(3,1)] / C(8,3) = (10 · 3) / 56 = 30/56 = 15/28 ≈ 0.5357
Interpretation: if you repeat the same 3-draw experiment many times, about 53.6% of experiments contain exactly two red balls.
Example 2 — At least 1 white in 4 draws (with replacement)
Urn: 2 white, 4 black → N = 6, R = 2, so p = 2/6 = 1/3. Draw n = 4.
P(at least one) = 1 − (1 − p)^n = 1 − (2/3)^4 = 1 − 16/81 = 65/81 ≈ 0.8025
Logic focus: “at least one” is usually fastest by complement: compute “none” and subtract from 1.
Example 3 — All 2 drawn balls match in color (without replacement)
Urn: 4 red, 3 blue, 1 green → N = 8, draw n = 2.
P(all same) = [C(4,2) + C(3,2) + C(1,2)] / C(8,2) = (6 + 3 + 0) / 28 = 9/28 ≈ 0.3214
Key check: green has only 1 ball, so drawing 2 greens is impossible → C(1,2)=0.
🖼️ Infographic & Visual Guide
The infographic summarizes the one decision that matters most in urn problems: Does the composition change after a draw? If yes → hypergeometric (without replacement). If no → binomial (with replacement).
How to use the page visuals correctly
- Ball composition visual: sanity-check the urn proportions (helps catch “I typed 30 instead of 3” errors fast).
- Simulation bar chart: a teaching view of sampling noise—expect wiggles at low trial counts.
- Random draw visualizer: concrete outcomes per experiment; great for “predict then test” classroom demos.
If you want more probability practice tools, try the Deck of Cards Probability Calculator or browse the RNG & Probability hub.
🧩 Use Cases (who this calculator helps most)
- Students: check homework for urn problems, “exactly k”, and “at least one” questions.
- Teachers: show the difference between replacement modes and demonstrate Monte Carlo convergence live.
- Programmers: validate your own simulation code against exact binomial/hypergeometric outputs.
- Self-learners: build intuition by changing one parameter at a time (more draws, more target balls, switch mode).
- Forum/notes sharing: use Copy/Export/Print/PDF + share link to distribute reproducible examples.
Three “what-if” experiments that teach the most
- Hold proportions constant, increase draws: watch “at least one” climb quickly toward 100%.
- Switch only replacement mode: same urn, same n, same event → see why dependence matters.
- Make the event rare: try a tiny target color (e.g., 1 green in 50) and compare simulation stability at 1,000 vs 50,000 trials.
Related: if you’re specifically studying the “without replacement” model, see the dedicated Hypergeometric Distribution Calculator.
Reviewed: December 2025
❓ Frequently Asked Questions
What’s the difference between with replacement and without replacement?
With replacement puts the ball back each time, so the success probability stays constant and draws are independent (binomial). Without replacement removes the ball, so the composition changes and draws are dependent (hypergeometric).
Which distribution does the calculator use for each mode?
With replacement uses the binomial distribution. Without replacement uses the hypergeometric distribution. “At least one” is computed using the complement rule in both modes.
How do you compute “at least one” of a color?
Use the complement: P(at least one) = 1 − P(none).
With replacement: P(none) = (1 − p)^n.
Without replacement: P(none) = C(N−R, n) / C(N, n).
Why does the tool sometimes return probability 0?
Because the event is impossible for the inputs: drawing more balls than exist (without replacement),
asking for k larger than the available count, or “all same color” when no color has at least n balls.
What does the Monte Carlo simulation show?
It runs the same experiment many times and estimates probability by frequency, then compares that estimate to the exact theoretical probability. With more trials, the estimate usually gets closer to the exact value.
Does the simulator use true randomness?
It uses your browser’s pseudo-random generator. That’s fine for education and Monte Carlo intuition, but it’s not cryptographically secure.
Can I model more than two colors?
Yes. Add as many colors as you want. For events focused on one target color, all other colors are treated as “non-target”
in the underlying formulas (e.g., N−R).
How is “all drawn balls are the same color” calculated?
With replacement: P(all same) = Σ p_c^n.
Without replacement: P(all same) = [Σ C(C_c, n)] / C(N, n), counting only colors with enough balls.
Can I share or export my calculation?
Yes. Use Copy/Export/Print/PDF/Share Link actions under the results to save a record or share a reproducible scenario.
Is this tool intended for gambling or betting strategies?
No. It’s intended for learning, teaching, homework checking, and probability intuition—not for high-stakes decisions.
Important: This Ball & Urn Probability Calculator is provided for educational and exploratory purposes only. It is not intended for real-money gambling, betting systems, financial decisions, or security-critical use.